A Data Hobo's Almanac

A slow walk with AI through the world of small data

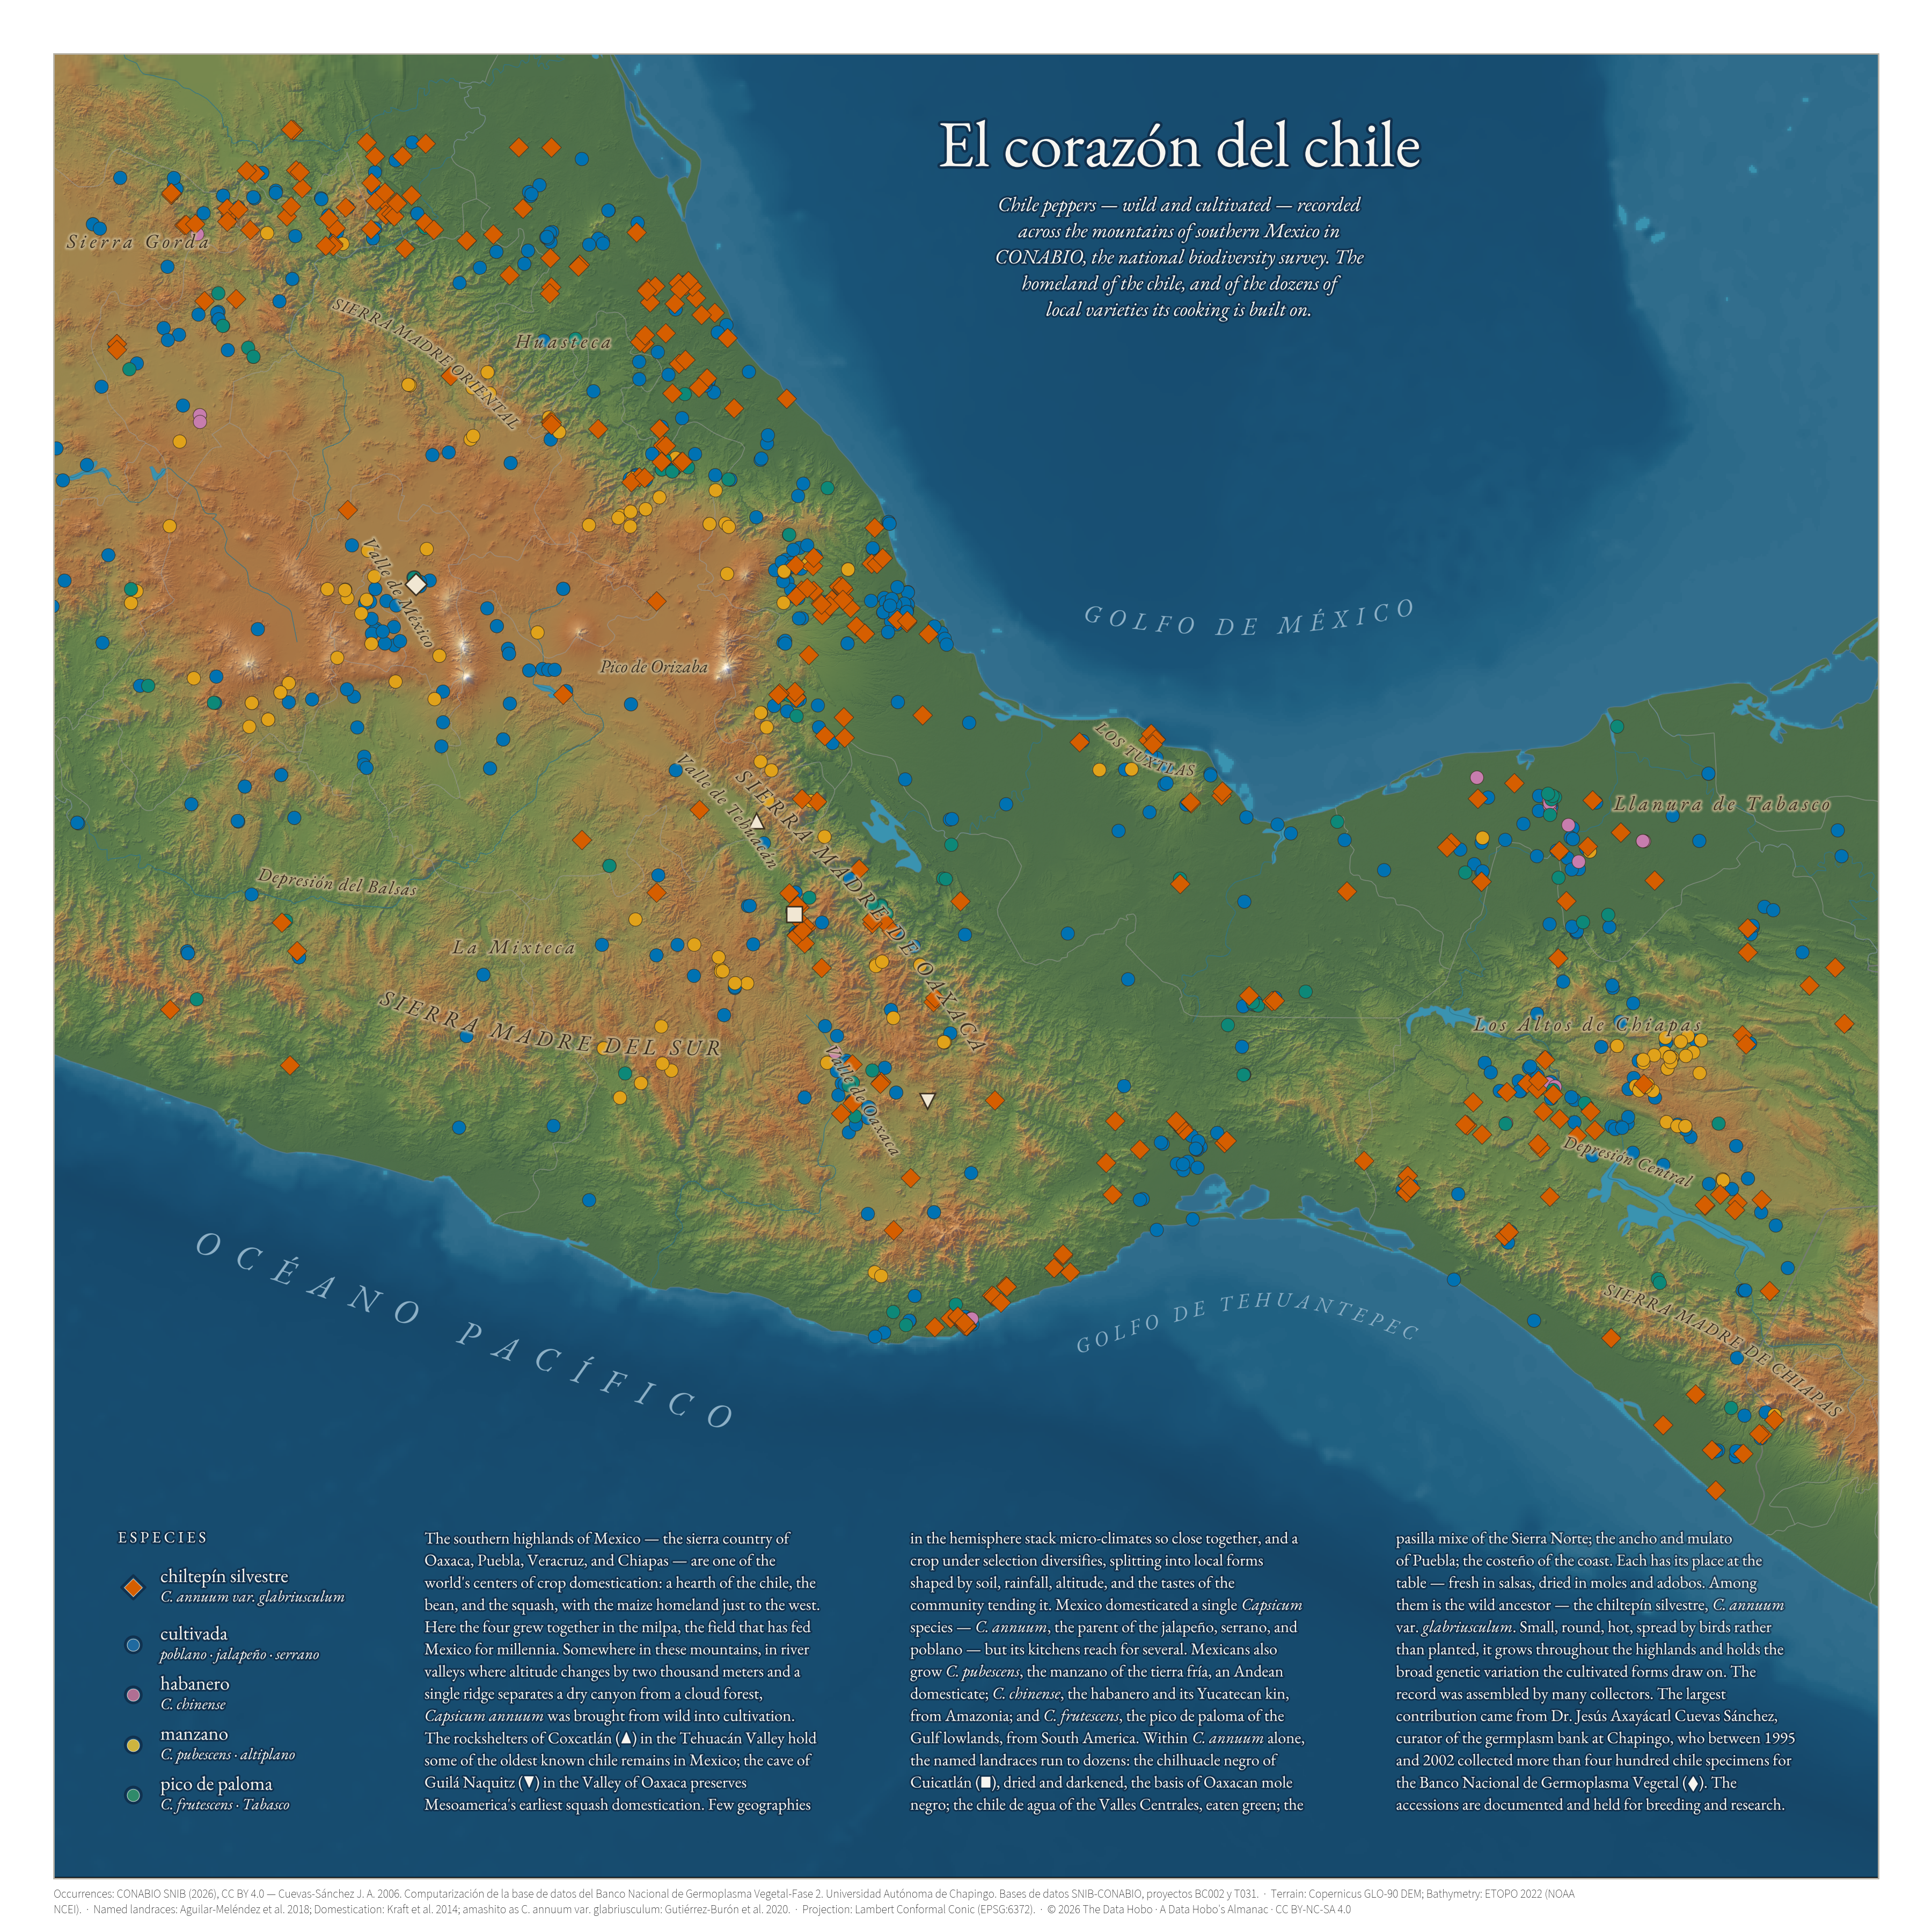
El corazón del chile
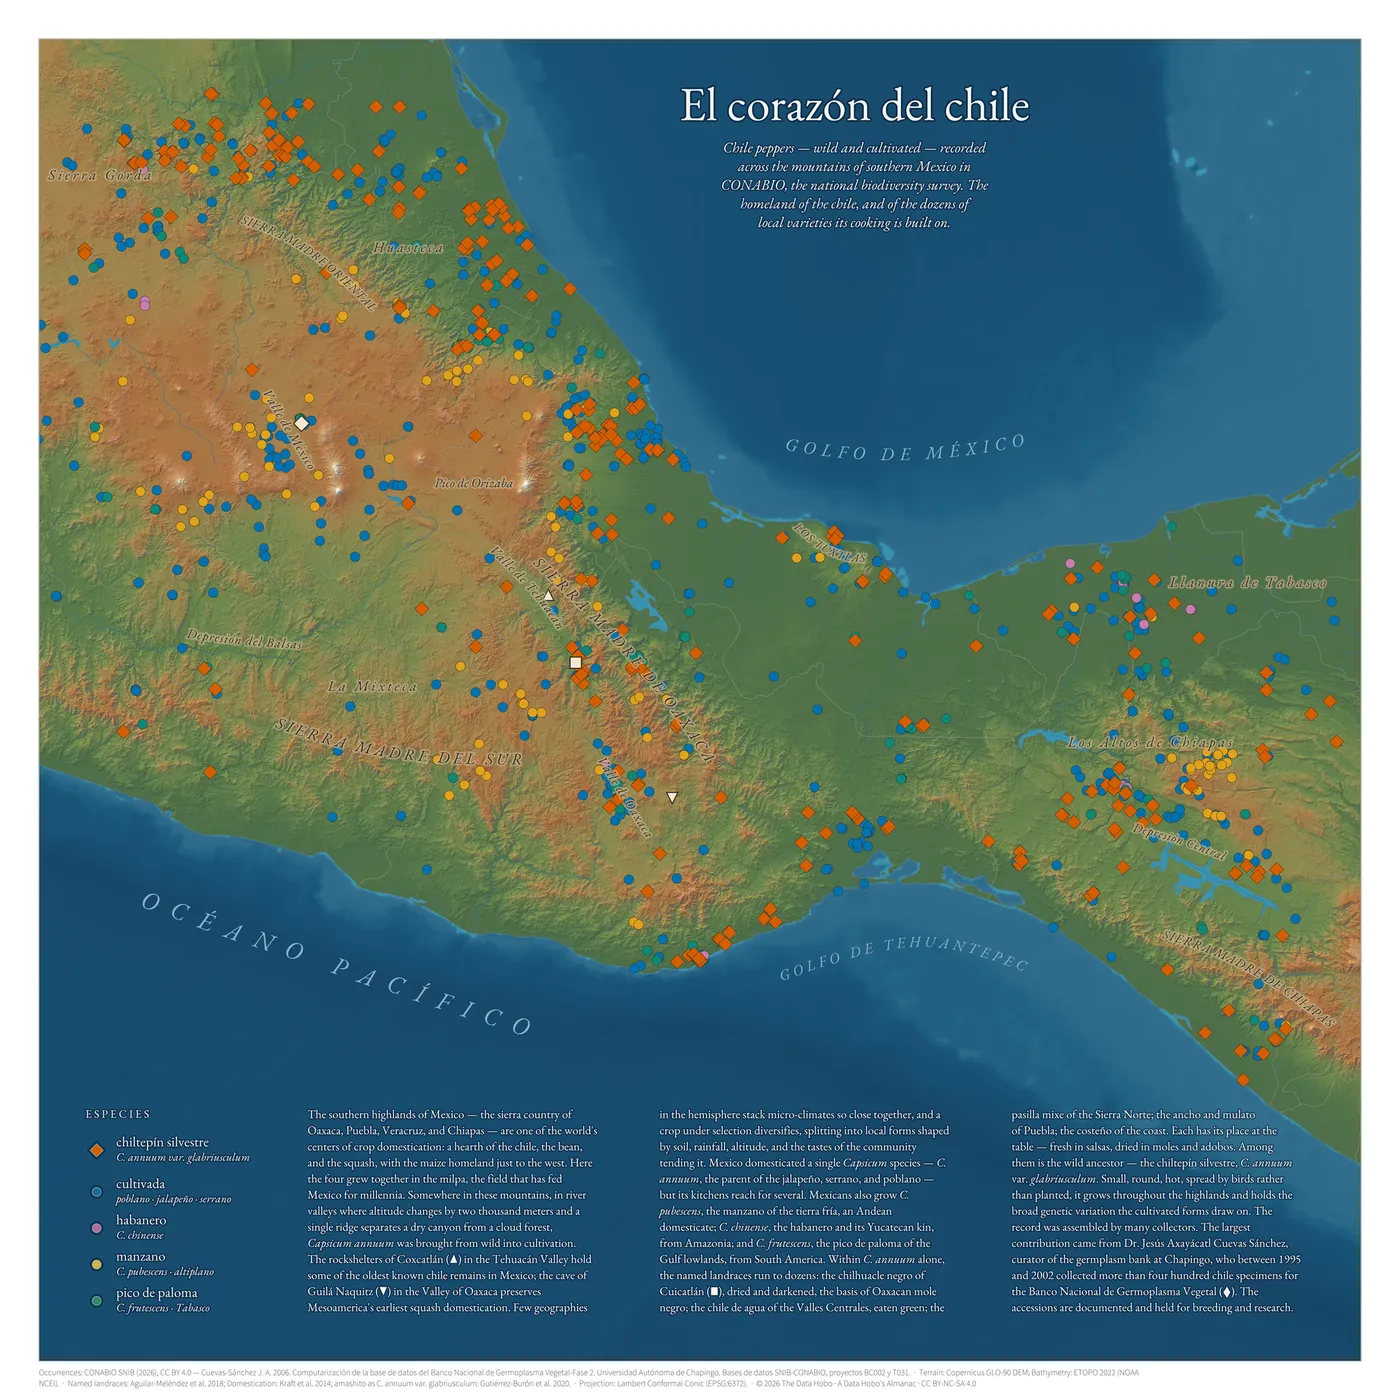
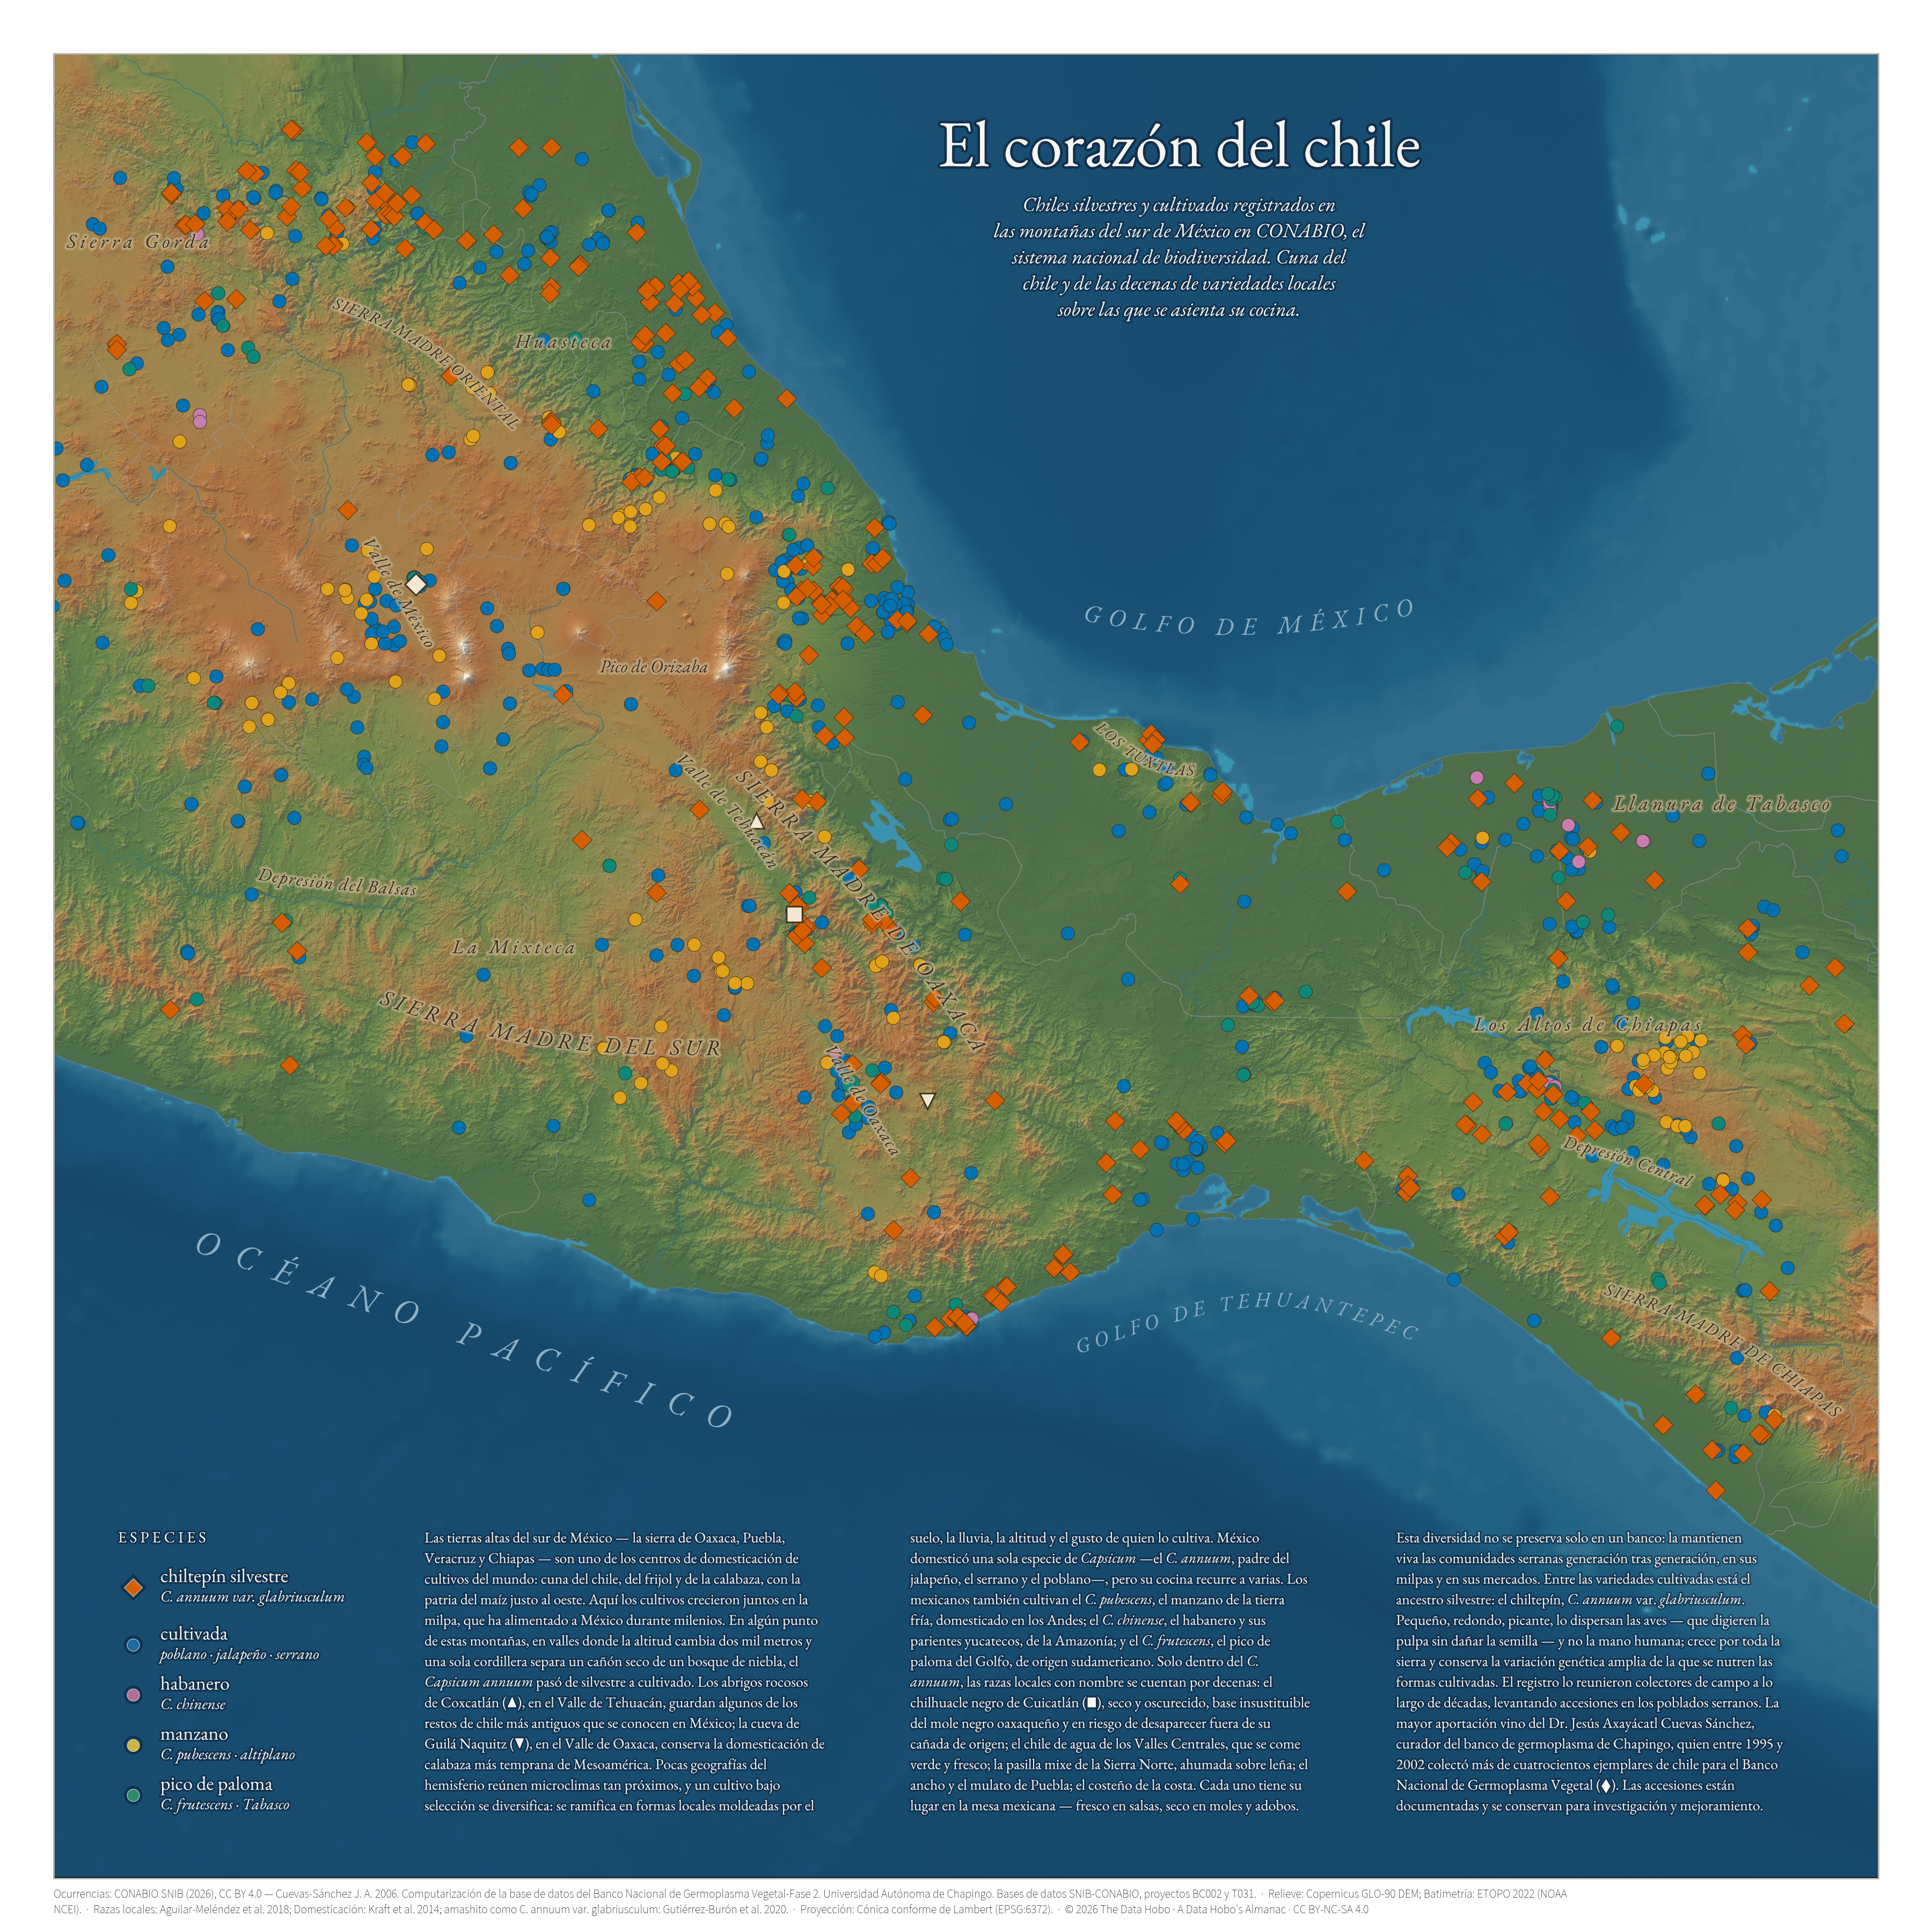
Map of wild and cultivated chile peppers across the mountains of southern Mexico, drawn from CONABIO's national biodiversity records over shaded terrain.

EN PNG · PDF   ·   ES PNG · PDF

A map of the chile peppers — wild and cultivated — recorded across the mountains of southern Mexico, the sierra country where Oaxaca, Puebla, Veracruz, and Chiapas meet. This is one of the world’s hearths of crop domestication and the homeland of the chile: here Capsicum annuum, the species behind the jalapeño, serrano, poblano, and most of Mexico’s chiles, was brought from wild into cultivation. Within it alone the named landraces run to dozens — the chilhuacle negro of Cuicatlán that darkens Oaxacan mole negro, the chile de agua eaten fresh in the Valles Centrales, the pasilla mixe smoked over oak in the Sierra Norte. The wild ancestor, the bird-sown chiltepín, still grows throughout the highlands and holds the genetic variation the cultivated forms draw on.

Each point is an occurrence record from CONABIO’s Sistema Nacional de Información sobre Biodiversidad, laid over Copernicus GLO-90 terrain. The record was assembled by many field collectors over decades; the largest single contribution came from Dr. Jesús Axayácatl Cuevas Sánchez, who between 1995 and 2002 gathered more than four hundred chile specimens for the national germplasm bank at Chapingo. The domestication account follows Kraft et al. (2014), and the landrace nomenclature and geography follow Aguilar-Meléndez et al. (2018); the occurrence data is CONABIO SNIB, used under CC BY 4.0.
Approaches to New York Harbor

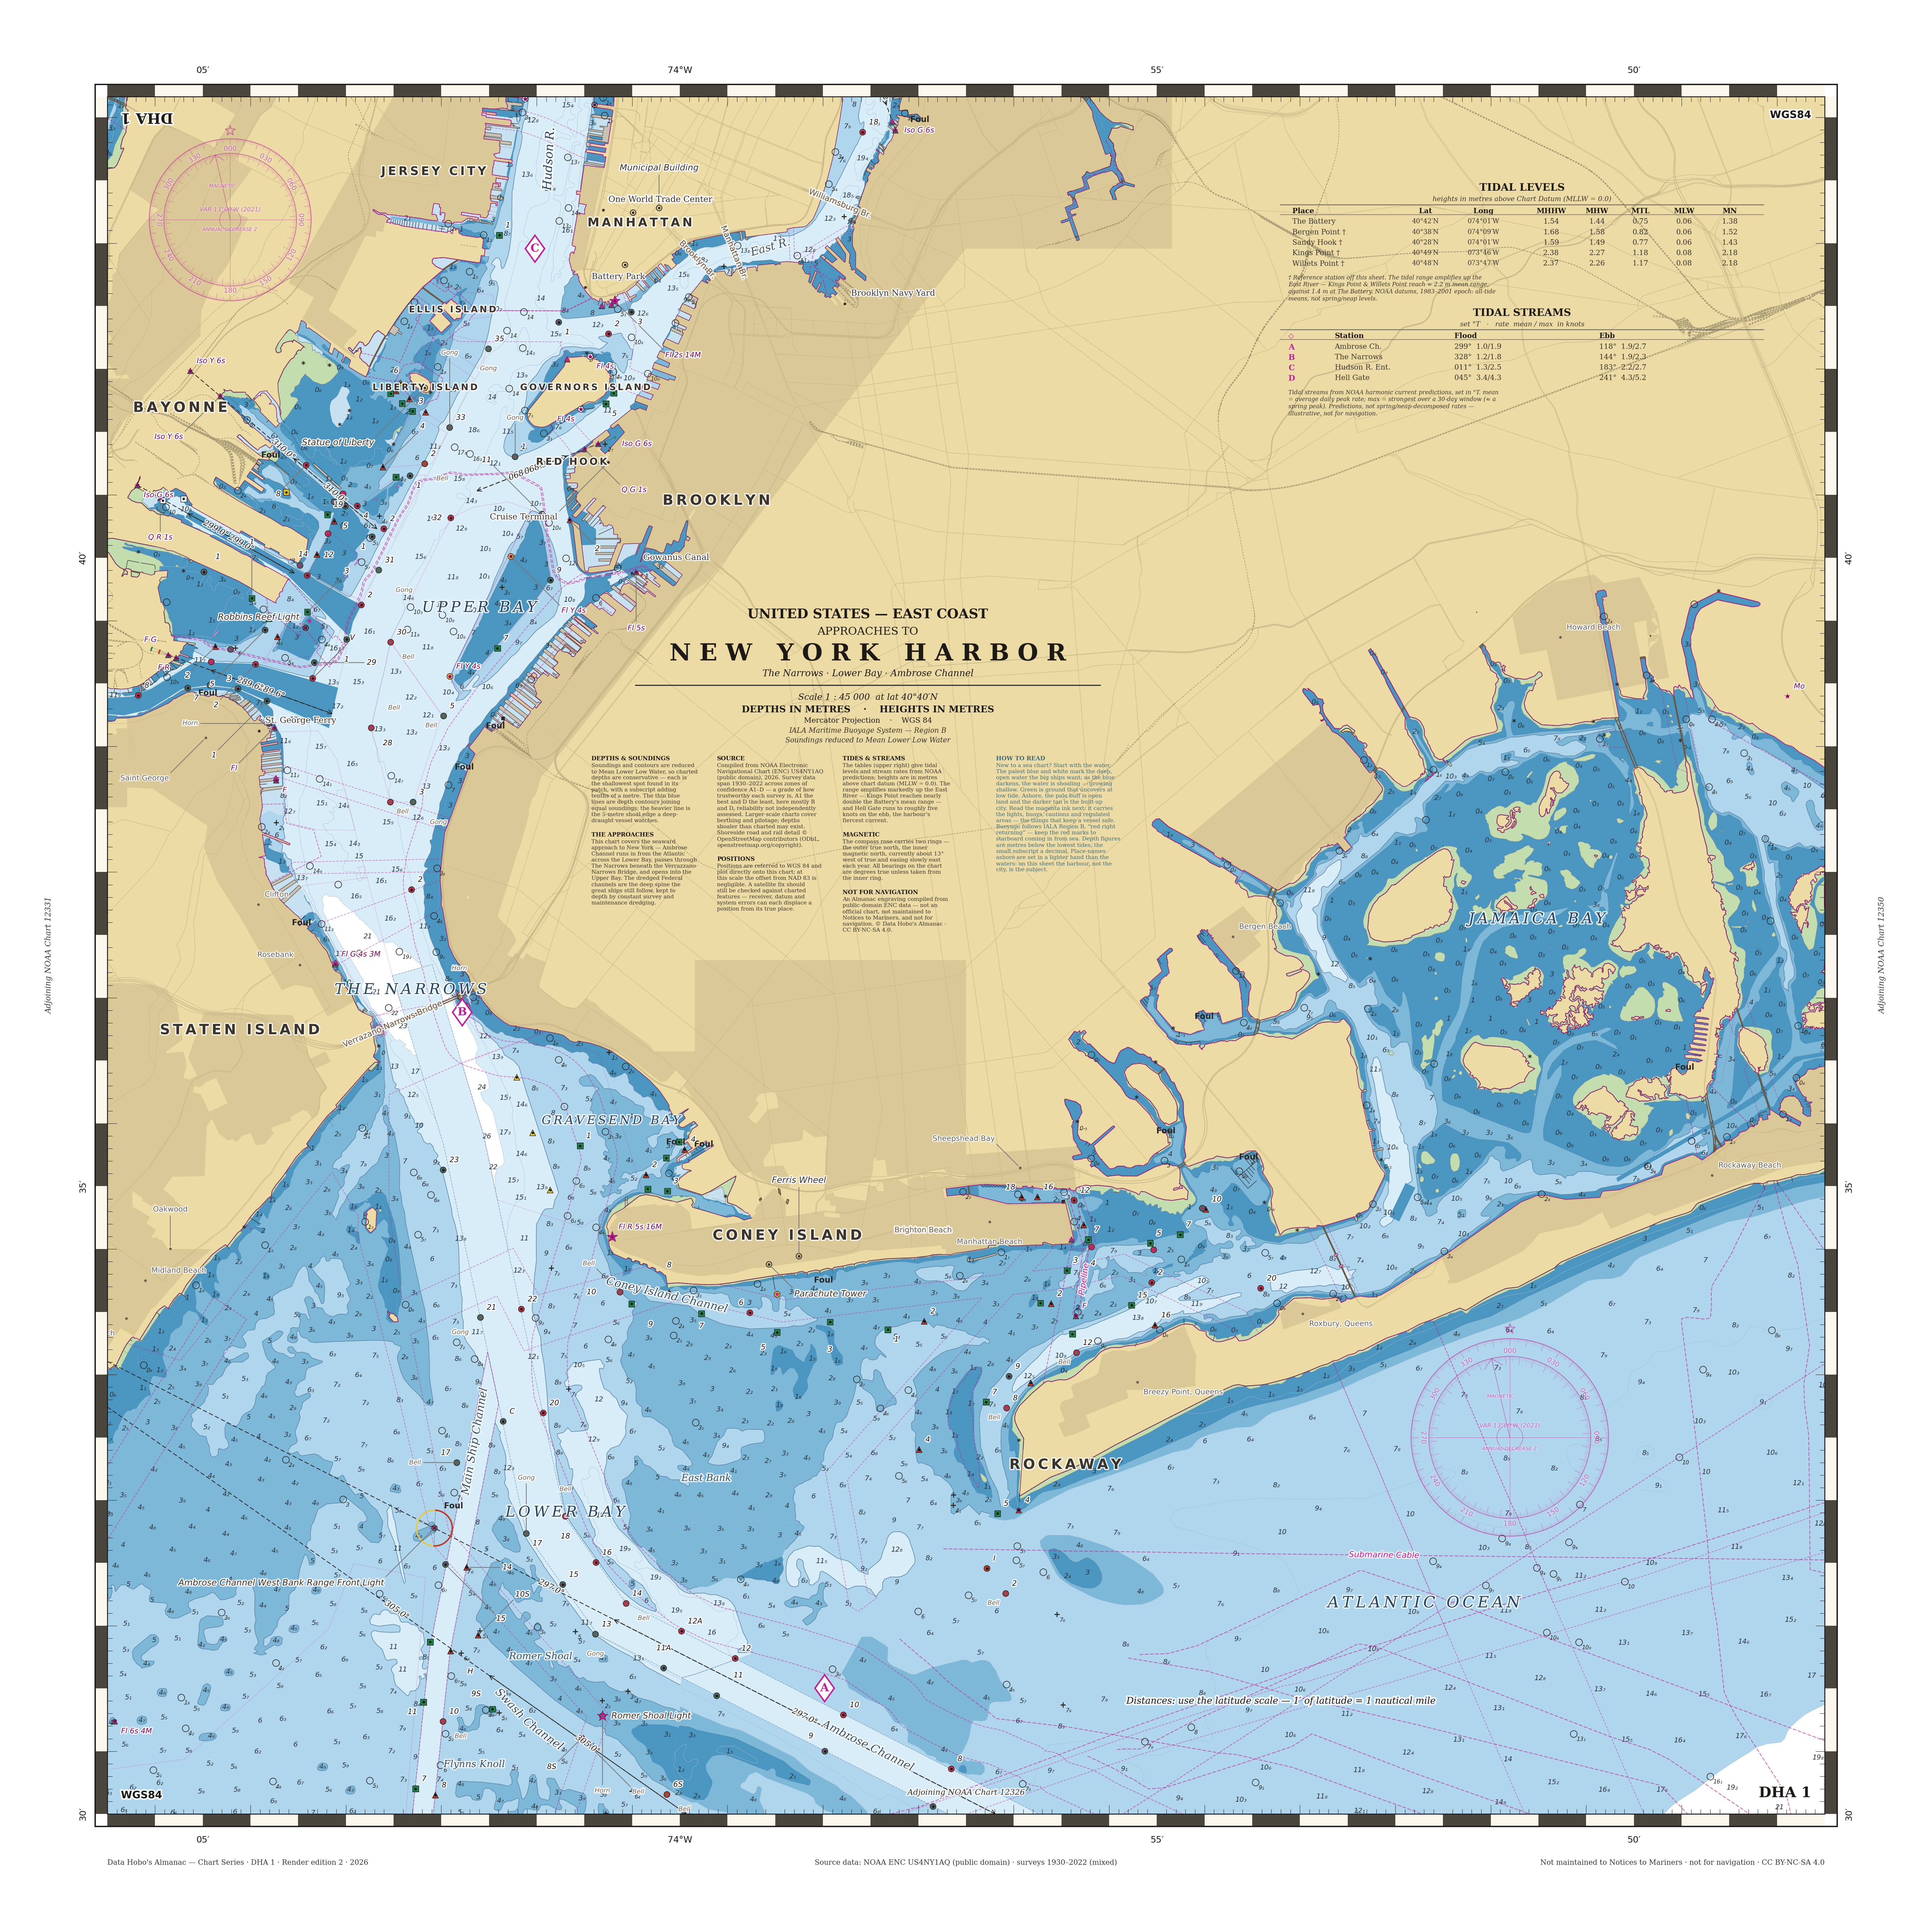
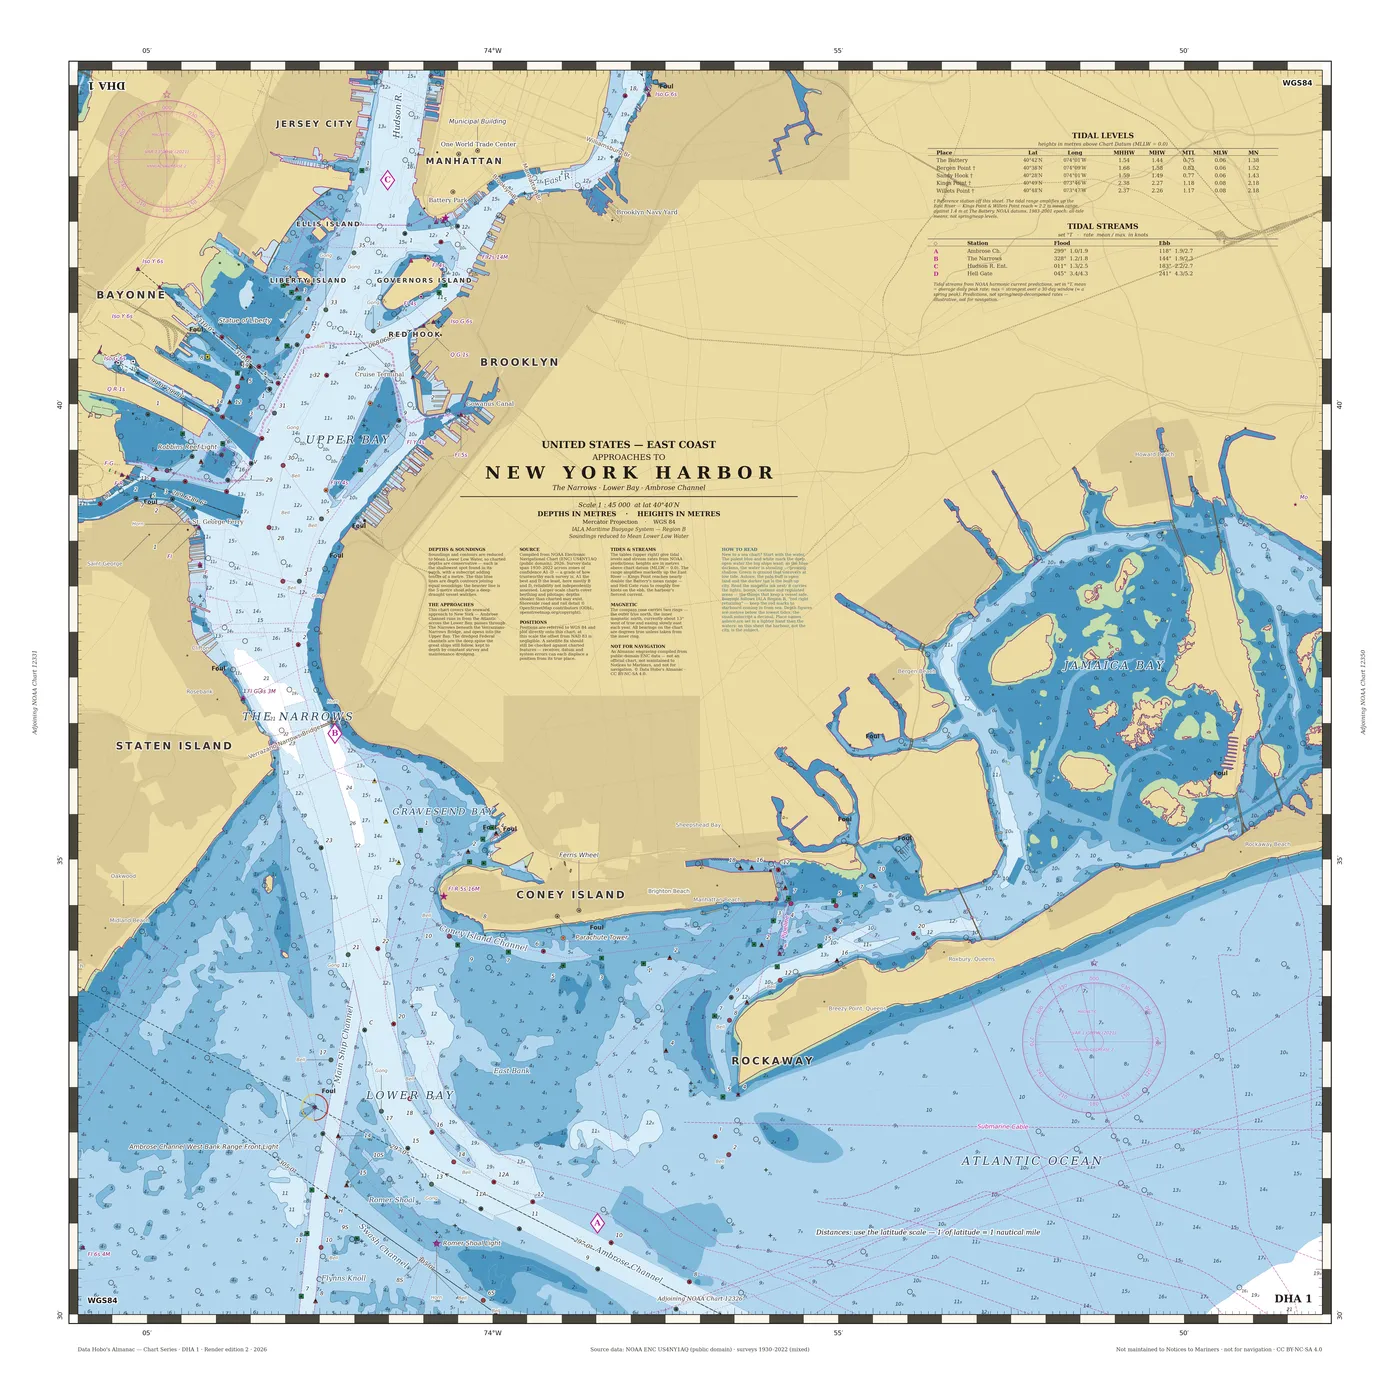
Nautical chart of the approaches to New York Harbor.

PNG · PDF

A nautical chart of the approaches to New York Harbor, drawn in the style of a modern electronic navigational chart. It covers the seaward gateway to the port — the Lower Bay, the Narrows between Staten Island and Brooklyn, and the Anchorage Channel that carries traffic up toward the Hudson and East Rivers. Soundings and depth contours are given in metres, and the familiar bands of blue step from the shoals and flats out to the deeper water of the dredged channels.

It is rendered from NOAA’s public-domain Electronic Navigational Chart for the harbor — cell US4NY1AQ — compiled from hydrographic surveys spanning 1930 to 2022. The shoreside road and rail detail is drawn from OpenStreetMap. The symbology follows the international S-52 convention used on shipboard chart displays, and the margins carry the usual furniture of a paper chart: a compass rose, tidal-level and tidal-stream tables, and the datum note (WGS 84). It is a faithful reproduction of the cartographic form, not a working document — it is not maintained to Notices to Mariners, and it is not for navigation.

How New York Became a City of Pizza and Bagels

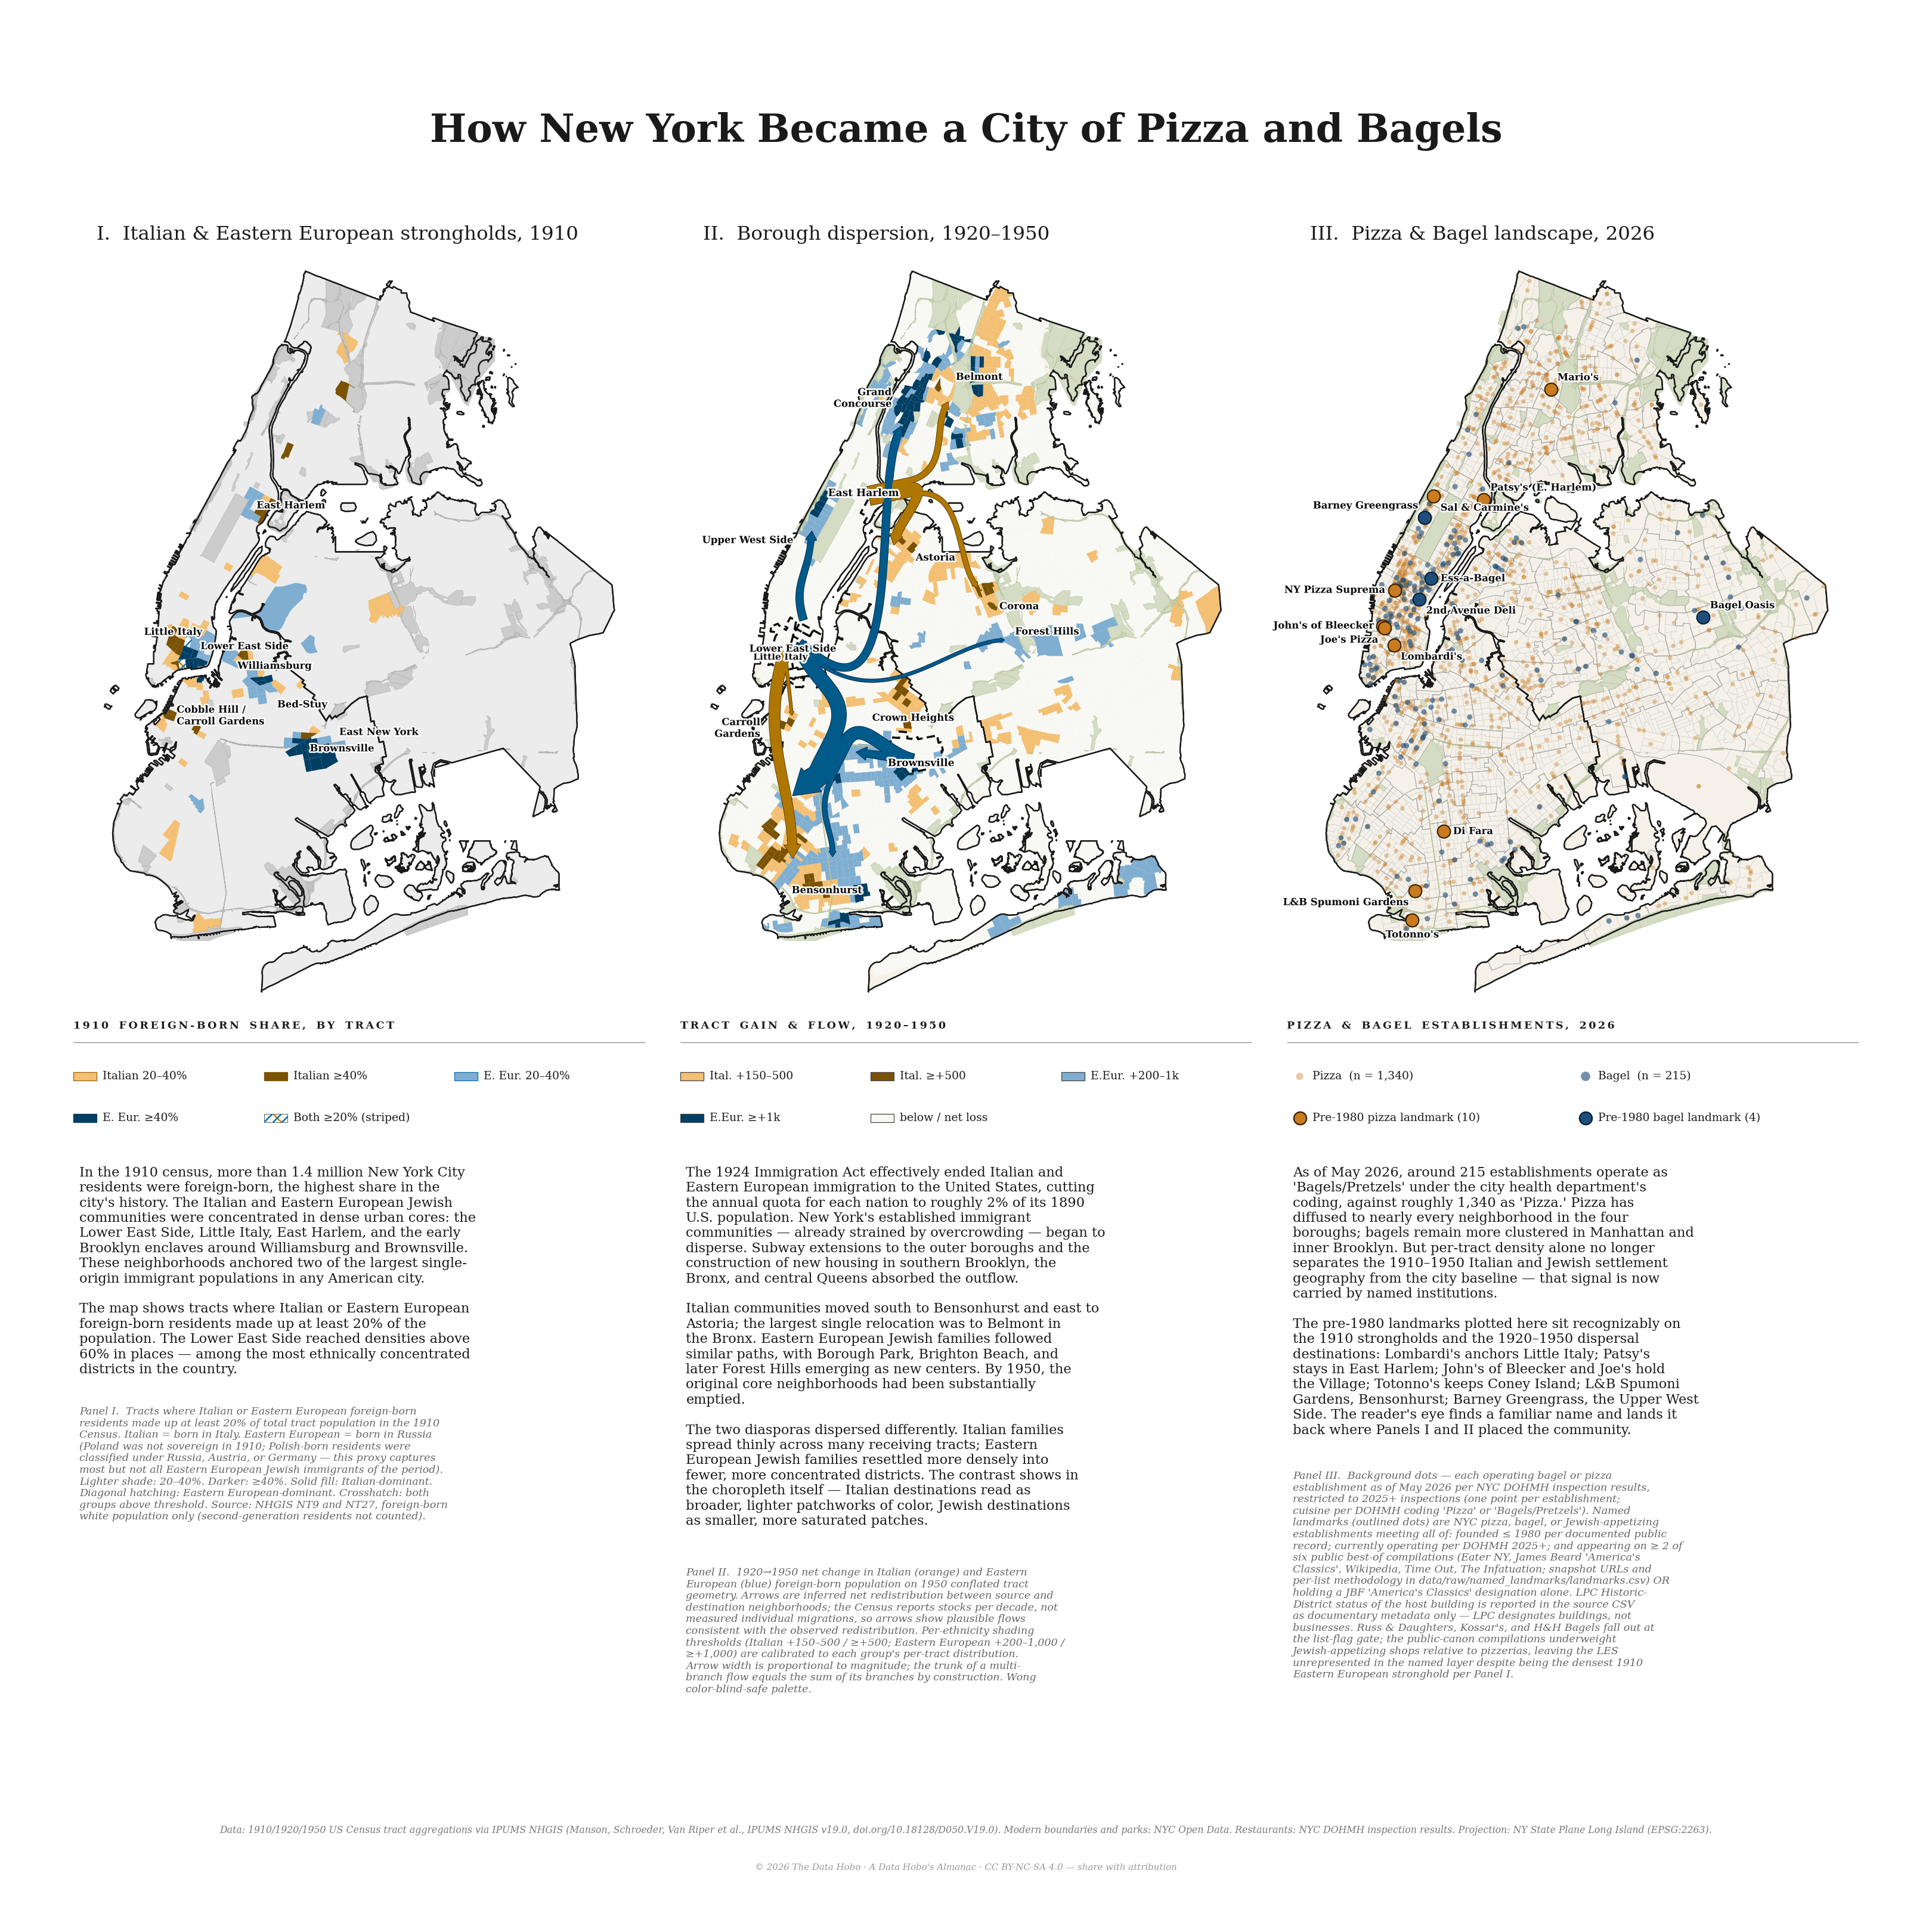
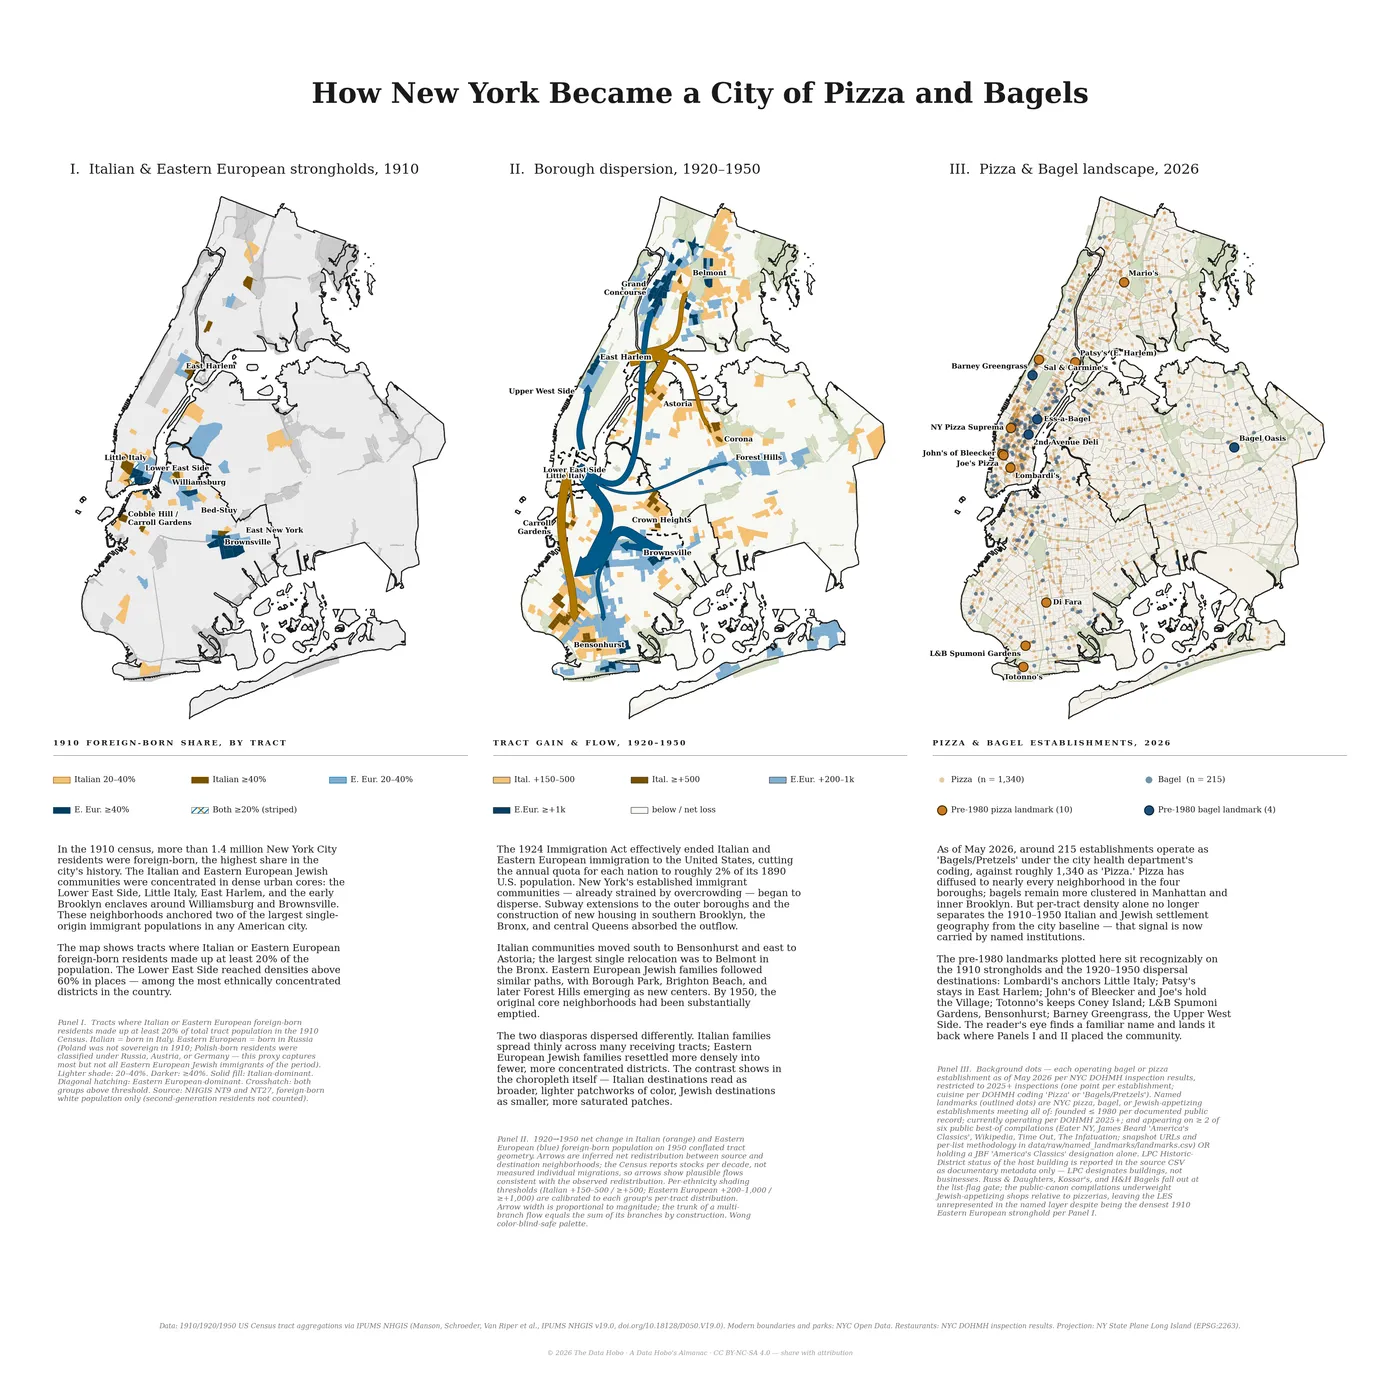
Three-panel map of Italian and Eastern European settlement and modern pizza and bagel shops in New York City.

PNG · PDF

A three-panel thematic map of New York City, reading left to right across roughly a century. It follows two immigrant populations — Italian and Eastern European Jewish — from the tracts where they first concentrated, through their dispersal across the boroughs, to the city’s present-day scatter of pizzerias and bagel shops. All three panels share one projection and one colour register, so they read as a single continuous picture.

The left panel maps the 1910 foreign-born share of population by census tract, with each group’s strongholds picked out against the early city. The centre panel covers 1920 to 1950: flow arrows, their width proportional to the number of residents moving, carry each population out of its original core and into the wider boroughs. The right panel is 2026 — pizza and bagel establishments plotted as points over the modern street and park network.

The historical tracts are aggregated from the 1910, 1920, and 1950 US Censuses via IPUMS NHGIS; the modern boundaries and parks are from NYC Open Data, and the eating places from the city Health Department’s inspection records. It is drawn in the Wong colour-blind-safe palette and projected on the New York State Plane (Long Island) grid.