How New York Became a City of Pizza and Bagels
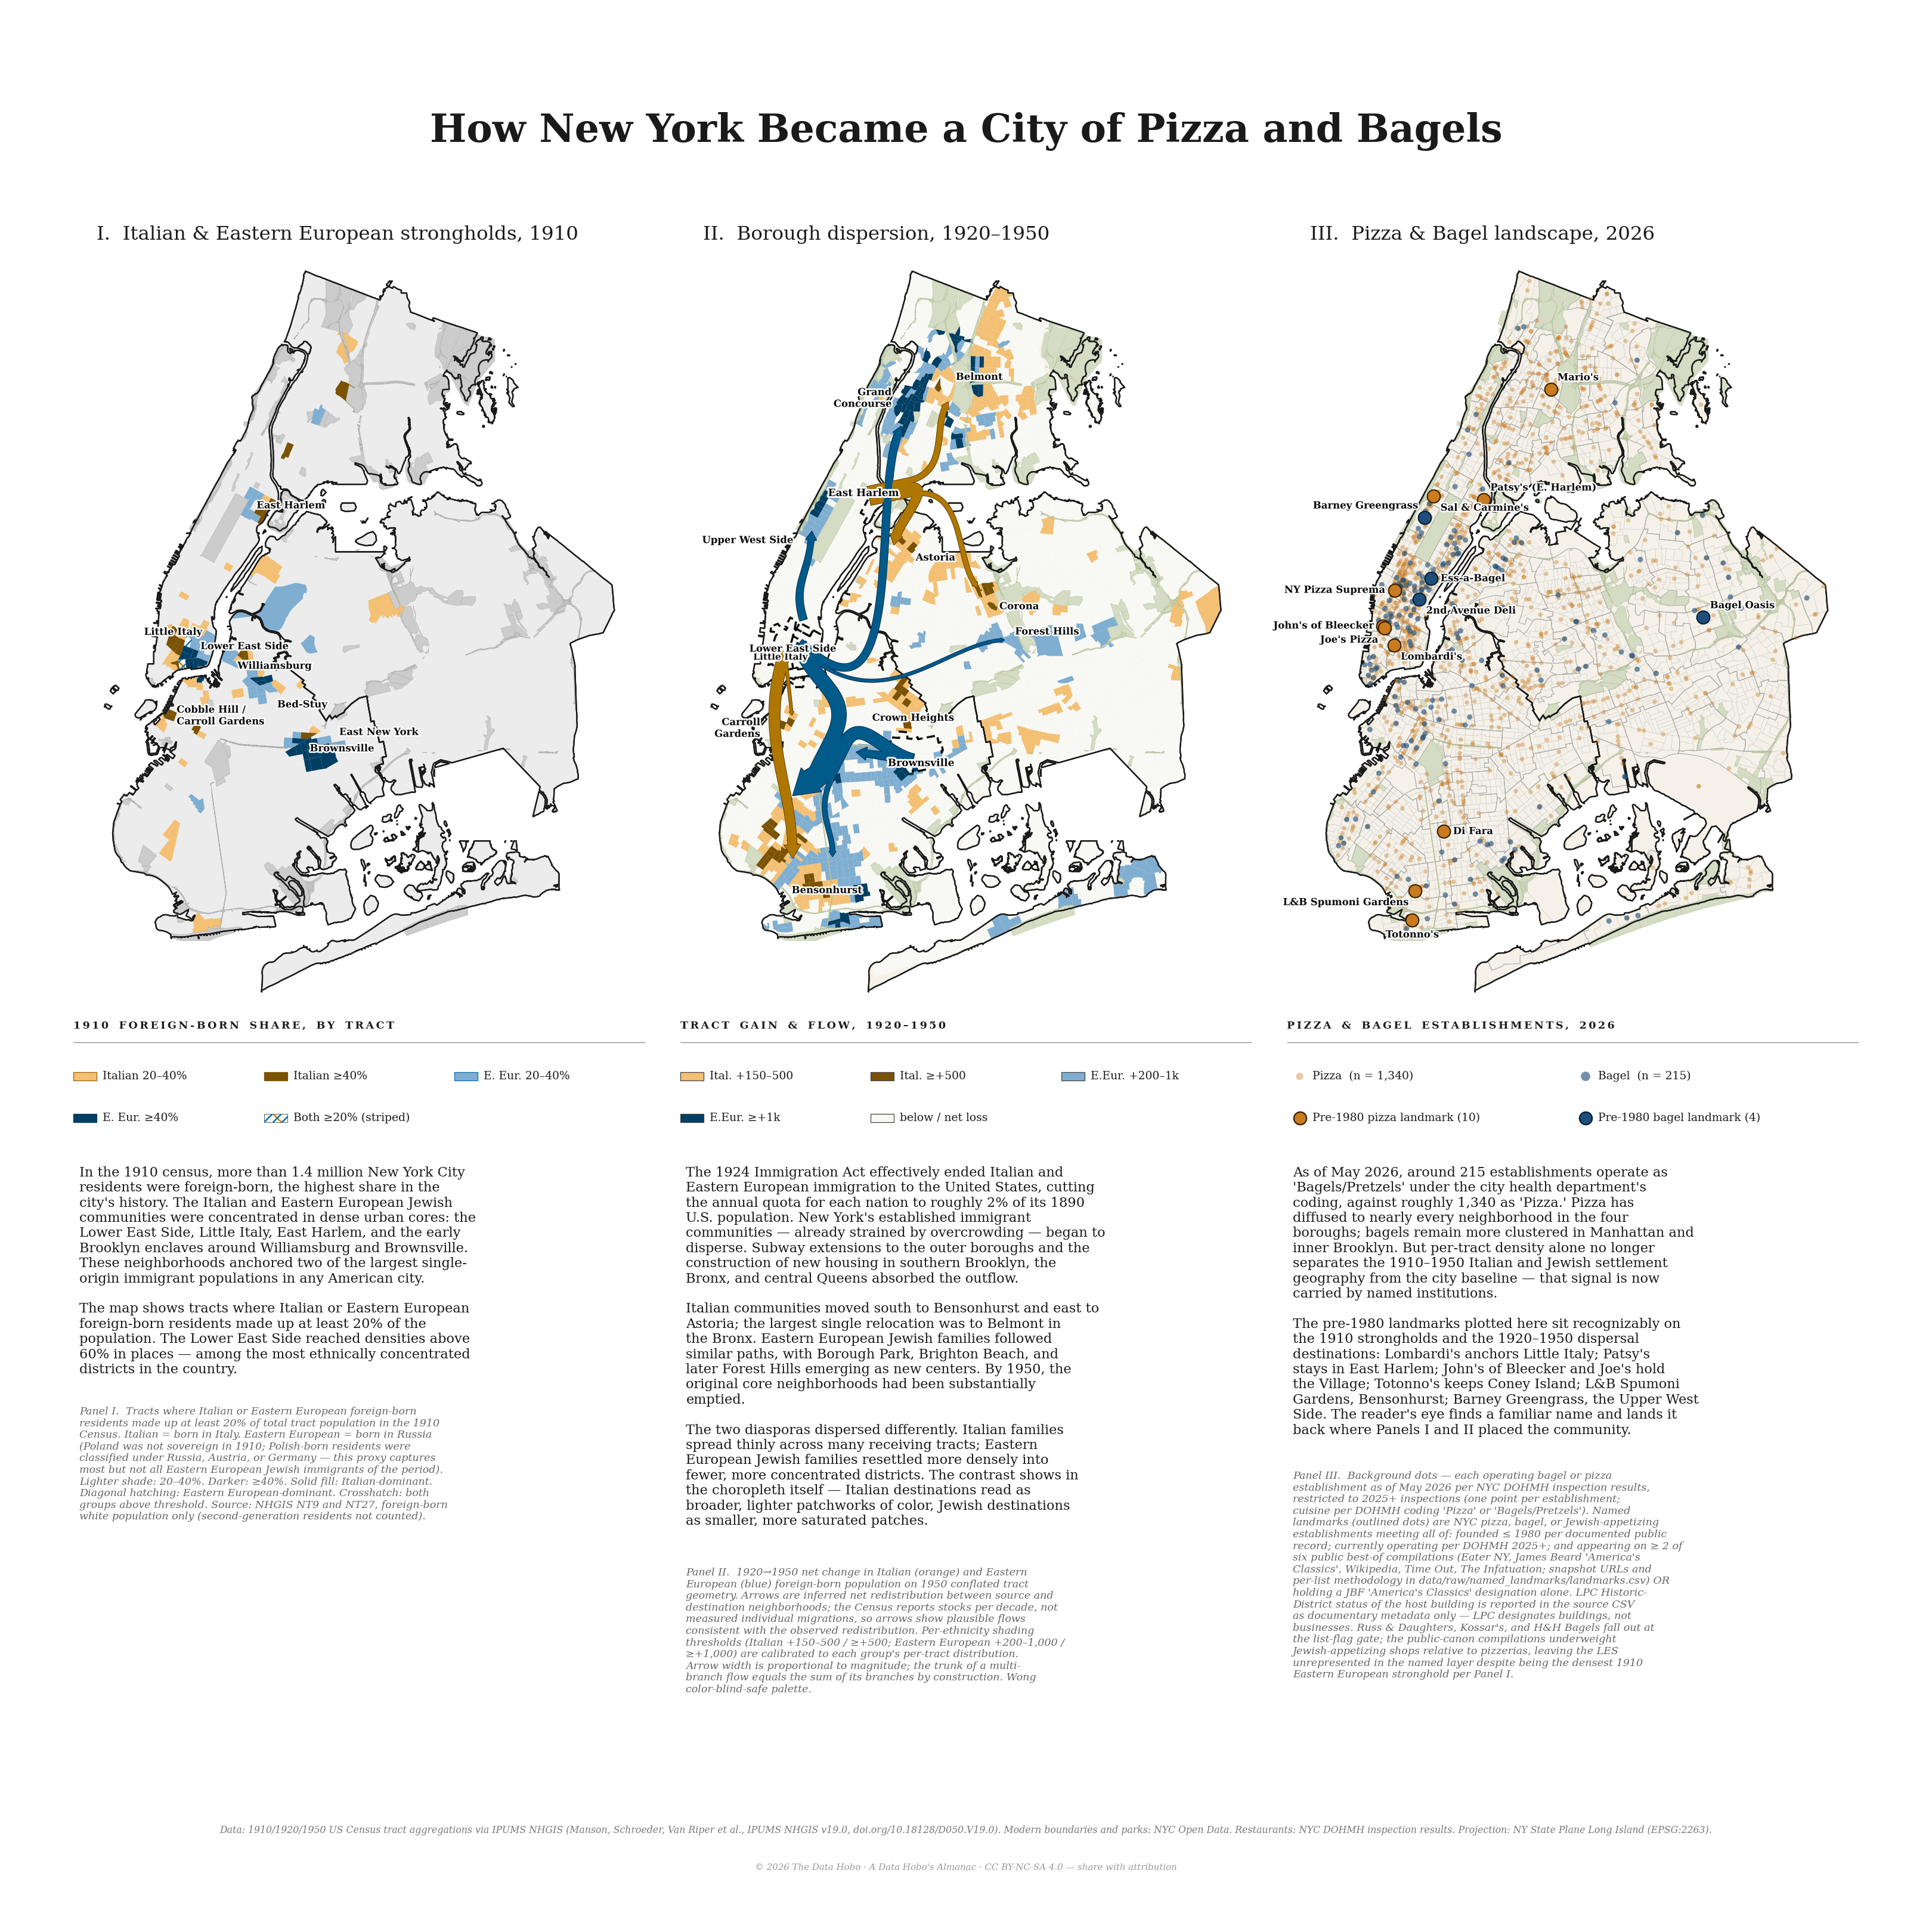
A three-panel thematic map of New York City, reading left to right across roughly a century. It follows two immigrant populations — Italian and Eastern European Jewish — from the tracts where they first concentrated, through their dispersal across the boroughs, to the city’s present-day scatter of pizzerias and bagel shops. All three panels share one projection and one colour register, so they read as a single continuous picture.
The left panel maps the 1910 foreign-born share of population by census tract, with each group’s strongholds picked out against the early city. The centre panel covers 1920 to 1950: flow arrows, their width proportional to the number of residents moving, carry each population out of its original core and into the wider boroughs. The right panel is 2026 — pizza and bagel establishments plotted as points over the modern street and park network.
The historical tracts are aggregated from the 1910, 1920, and 1950 US Censuses via IPUMS NHGIS; the modern boundaries and parks are from NYC Open Data, and the eating places from the city Health Department’s inspection records. It is drawn in the Wong colour-blind-safe palette and projected on the New York State Plane (Long Island) grid.